Decide with Data, Shape the Future
Track customer interactions and behaviors, analyze this data comprehensively, and create meaningful reports. Use data analytics in decision-making, budgeting, and planning.


Statistics
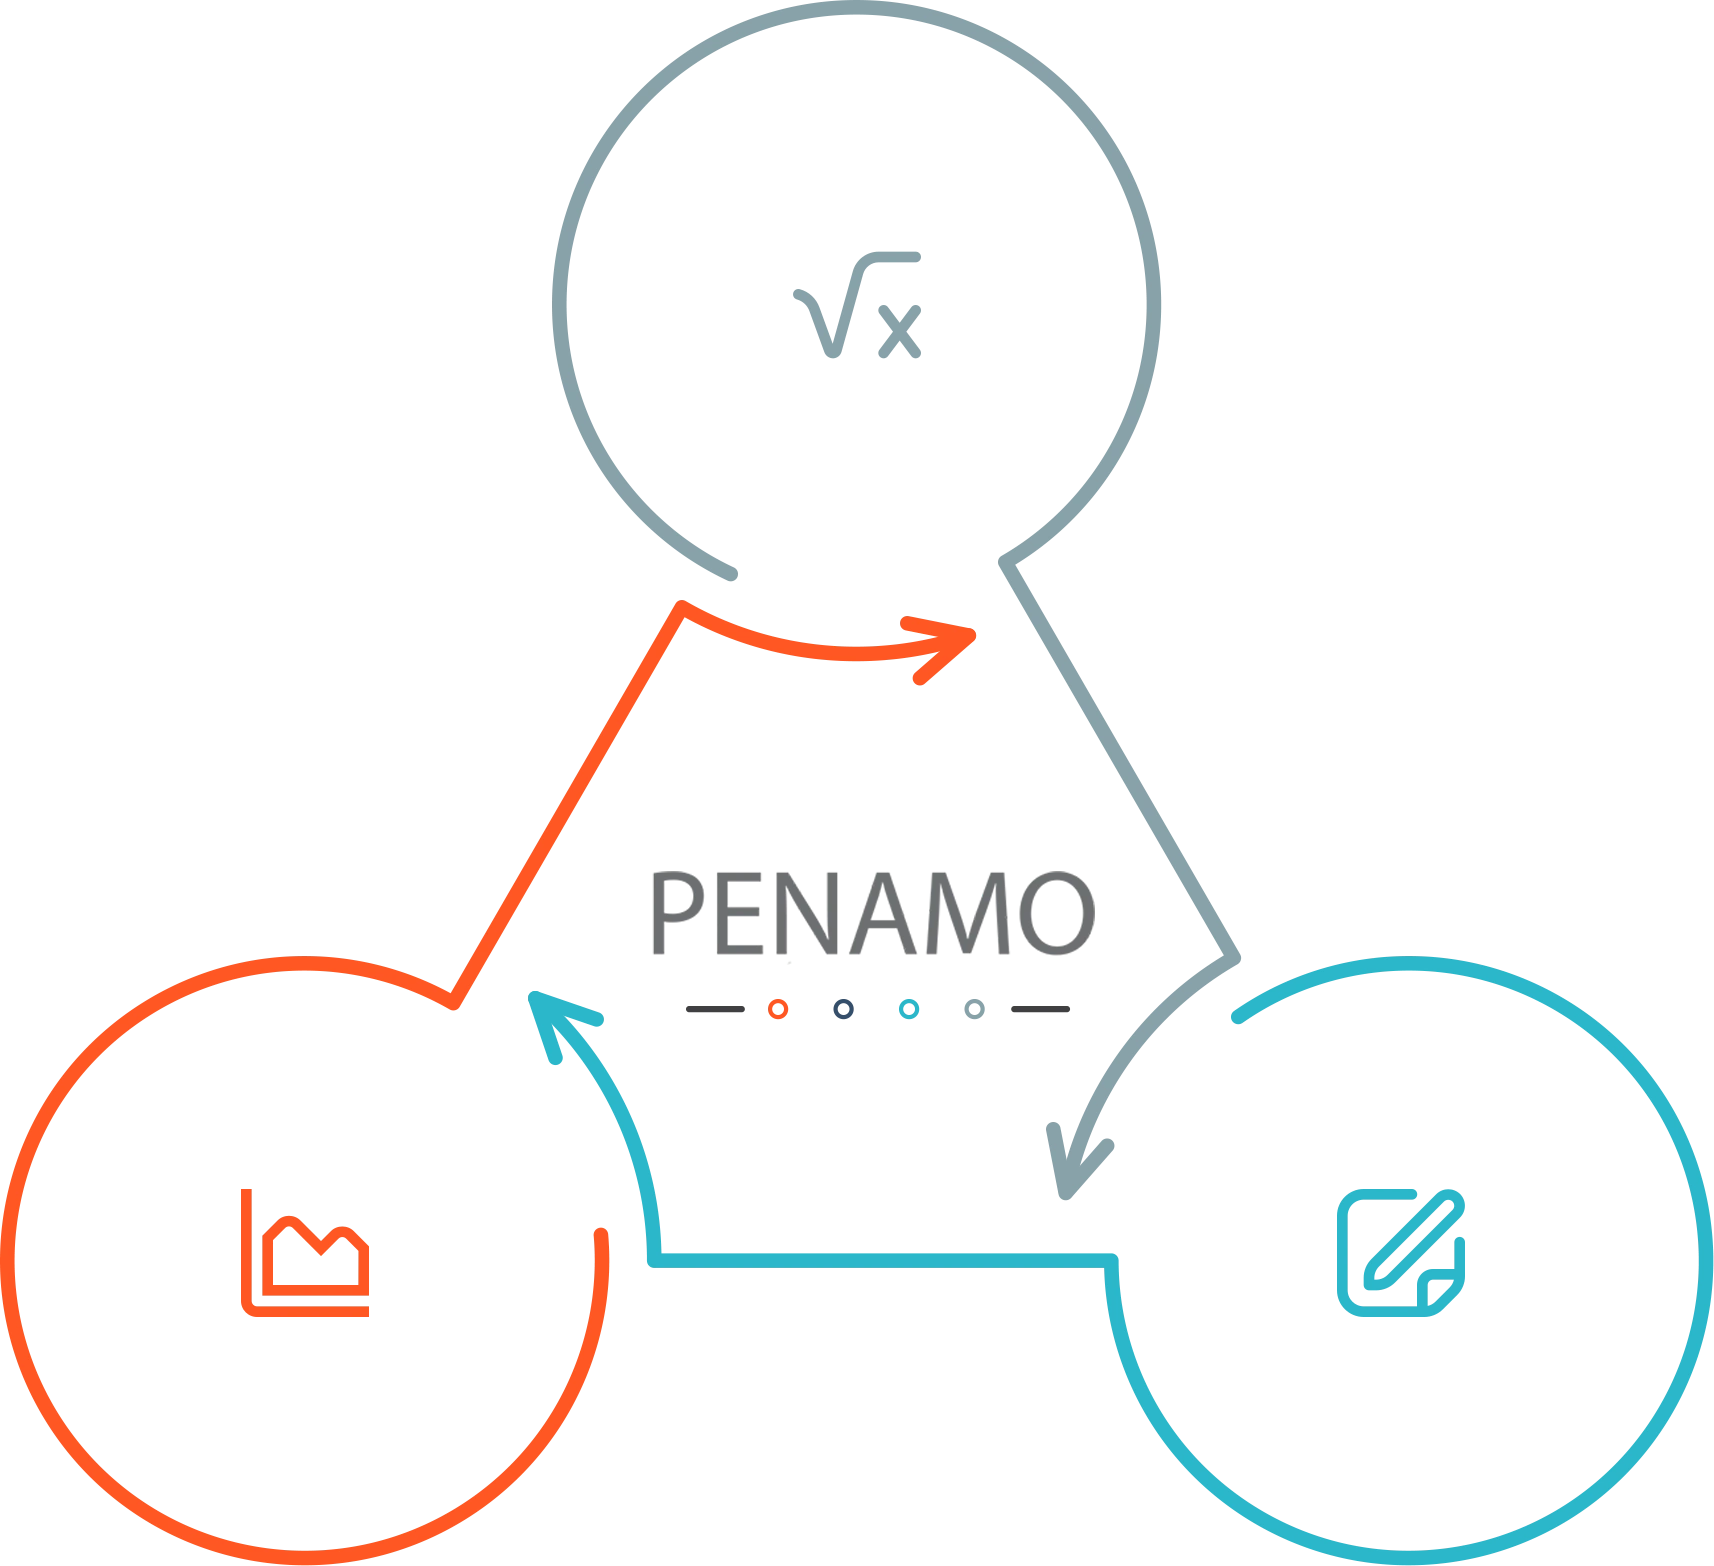
Penamo provides comprehensive statistics by analyzing data from various applications such as deals, activities, visits, and searches.

Analysis
Make more informed decisions by analyzing data from your applications such as invoices, proformas, quotes, orders, and support tickets.

Reporting
Create detailed reports for many of your applications such as purchasing, ordering, production, finance and accounting.

Indicators and KPIs
Manage your business processes more efficiently by displaying application indicators and key performance indicators in widget format.
- What is reporting and how is it different from data analysis?
Reporting is the presentation of analyzed data in a visual or written format. Data analysis is the process of examining data and making inferences, while reporting is the stage of sharing the results of these analyses.
- Why is data analysis needed?
Businesses need data analysis to support decision-making processes, evaluate performance, and conduct strategic planning.
- How frequently should reporting be done?
Reporting can be done daily, weekly, monthly or annually depending on the needs. In some cases, instant reports may be required for special projects.


